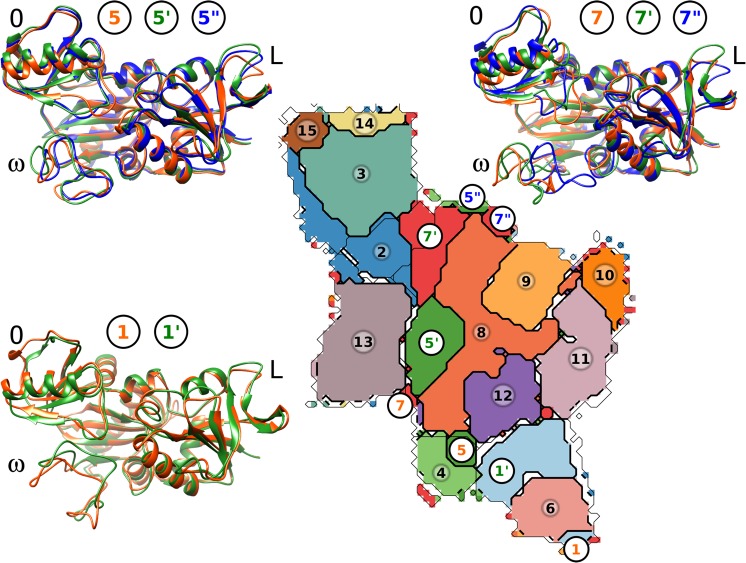
Figure 7.
Kinetic clustering of the VanA conformation using the Louvain greedy algorithm on the SOM neurones. A given color is associated with each of the 15 obtained clusters. For the three clusters, including nonconnected regions (1, 5, and 7), the disconnected regions are labeled, respectively, as 1 and 1′, 5 to 5″, and 7 to 7′′. The representative conformations corresponding to each disconnected region are drawn superimposed in cartoons.

