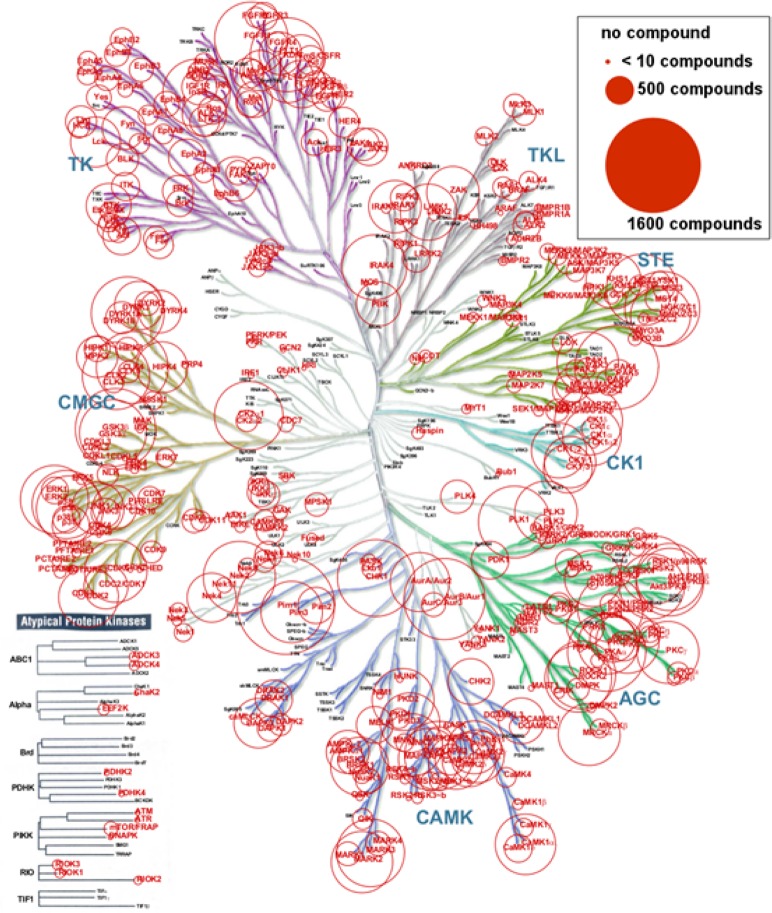
Figure 3.
Coverage of the kinome by the current data set. The kinase names and circles sizes are proportional to the number of corresponding compounds. The picture was generated using the Kinome Render,73 and the kinome tree illustration is reproduced courtesy of Cell Signaling Technology, Inc. (www.cellsignal.com). A high resolution version is available as Supporting Information Figure S2.

