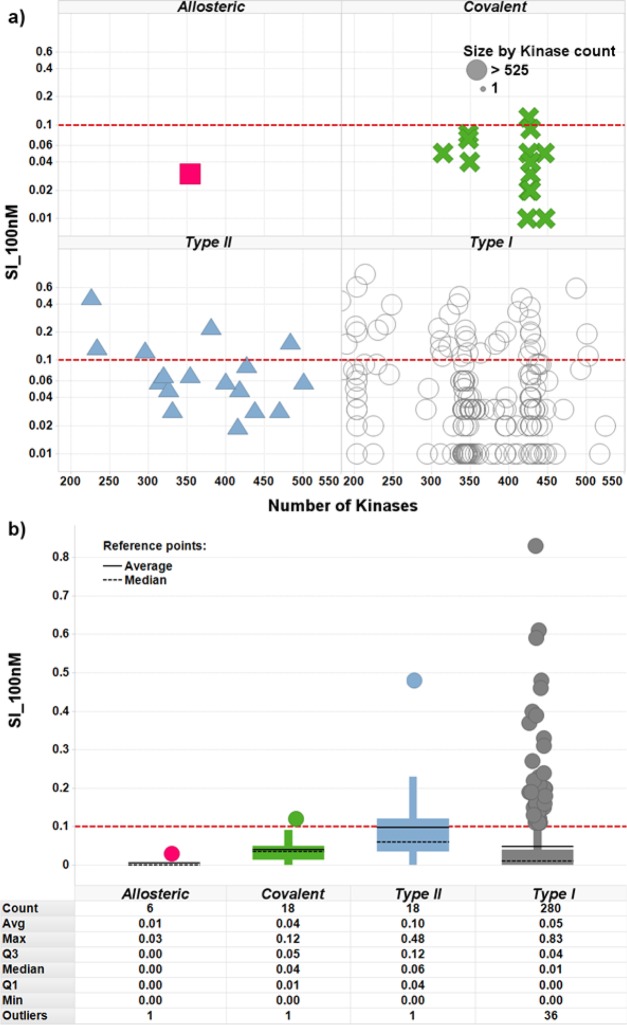
Figure 8.
Influence of the PKI binding mode on the kinase selectivity. (a) The x axis shows for each PKI the number of Kinases with at least one measurement, and the y axis shows in log scale the value of the SI_100 nM selectivity index. (b) The boxplots show the upper quartile, median, average, and lower quartile for the value of the SI_100 nM selectivity index.

