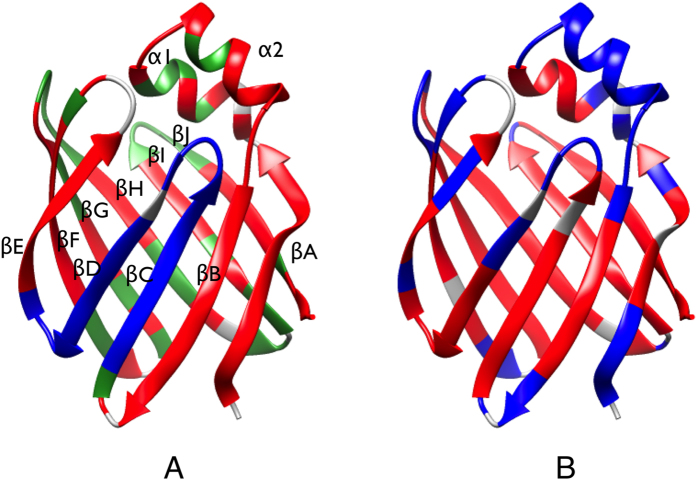
Figure 1.
(A) Distribution of residues displaying three conformational states (red), four states (blue), and no obvious relaxation dispersion (green). (B) Distribution of residues displaying amide hydrogen exchange protection factors larger than 100 (red) and smaller than 100 (blue). The residues without available data are colored in grey.

