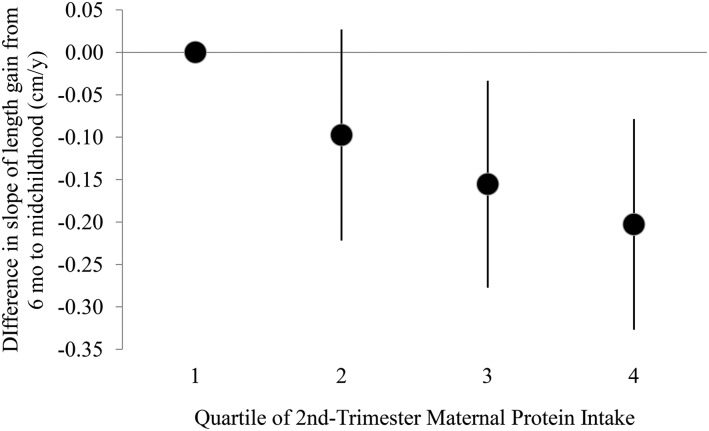
FIGURE 2.
Difference in slope of length gain from 6 mo to midchildhood (6 mo to 10.9 y of age; mean age 3.0 y) by quartile of maternal protein intake (grams per kilogram per day) compared with the lowest quartile of intake. Dots indicate the difference from the lowest quartile in the mean predicted random effect (i.e., mean slope) for subjects in that protein intake group, with 95% CIs indicated by error bars. From multivariable linear regression models adjusted for child sex and gestational age at delivery, maternal education, maternal race/ethnicity, household income at enrollment, maternal age at enrollment, gestational weight gain, maternal and paternal height, and duration of breastfeeding (months). Includes 1537 mother–child pairs.

