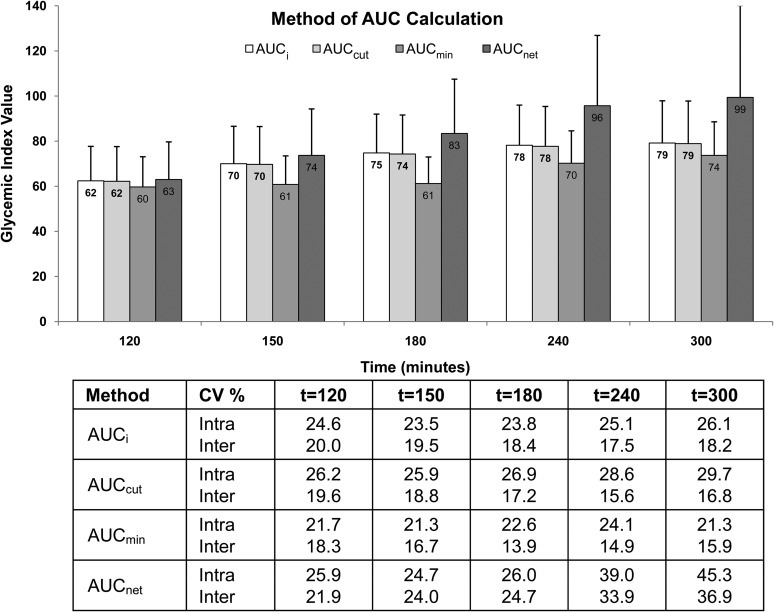
FIGURE 4.
Effect of method of AUC calculation on the intra- and interindividual variability in glycemic index values for white bread. The bar at each time point represents the glycemic index mean ± SD for all subjects (n = 63) calculated by using one of the following methods: AUCi, incremental AUC calculated geometrically as the sum of the areas of the triangles and trapezoids over 2 h, excluding the area below the initial fasting glucose concentration; AUCcut, cut AUC measured until the serum glucose concentrations first returned to the initial fasting glucose concentration; AUCmin, minimum AUC calculated by using the lowest serum glucose concentration as baseline; AUCnet, net AUC calculated by subtracting the sum of the negative areas of the triangles and trapezoids from the positive areas. The table below the figure shows the intra- and interindividual CV%, derived by using PROC VARCOMP. The square root of the subject variance divided by the mean glycemic index value yields the interindividual CV, whereas the square root of the error term divided by the mean glycemic index value yields the intra-individual CV.

