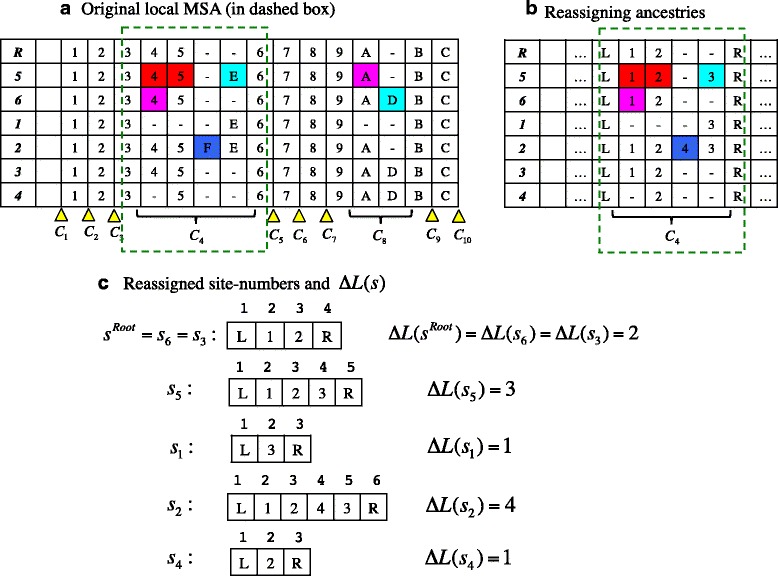
Fig. 1.

Notation and re-numbering of sites typical in this study. a An example MSA. The C κ’s (with κ = 1, 2, …, 10) label the regions that actually or potentially accommodate local indel histories (marked by bottom curly brackets and yellow wedges, respectively). As an illustration, we choose the local MSA confined in the region C 4 (the portion in the green dashed box), and re-assign the ancestry indices (in the cells) as shown in panel (b). Ancestries L and R were newly assigned to the flanking PASs. The ancestry indices in between the PASs are just examples and not always assigned in this way. (The indices in panel (a) could be regarded as hexadecimal numerals, if preferred.) c Subsequences extracted from the local MSA. Shown above each site (i.e., each cell) is the site number (i.e., spatial coordinate) re-assigned to it. And the ∆L(s) on the right of each sequence (s = s 1, …, s 6 or s Root) is the count of sites in between the PASs. In panels a and b, the boldface characters in the leftmost columns stand for the sequence IDs. (More precisely, the number ‘i’ stands for sequence s i, and the ‘R’ stands for the root sequence (s Root).) A dash (‘-‘) in a cell represents a gap. In panel b, triple dots (‘…’) in a cell indicate that the alignment continues outwards. Panel a was adapted from Figure S2 b of [22]. Panels b and c were adapted from Figure 1 of [43]
