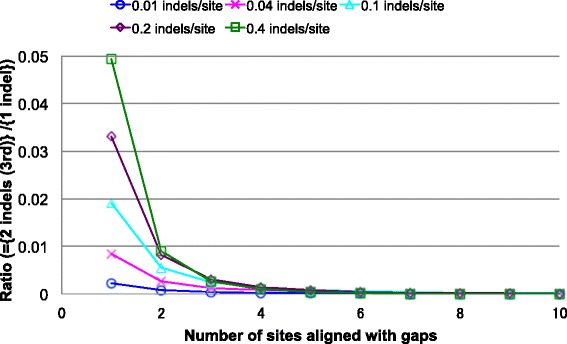
Fig. 5.

Perturbation analysis on local MSA probabilities in case (III). The graph shows the ratio of the contribution of the type (B) next-parsimonious history to that of the parsimonious history. The former history consists of a deletion along each of branches 2 and 3, and the latter consists of an insertion along branch 1. The ratio is shown as a function of the length of the gapped segment (∆L D1, abscissa) and the expected number of indels per site along each branch (different curves). The figure is a reduced and modified version of Figure 5 of [43]
