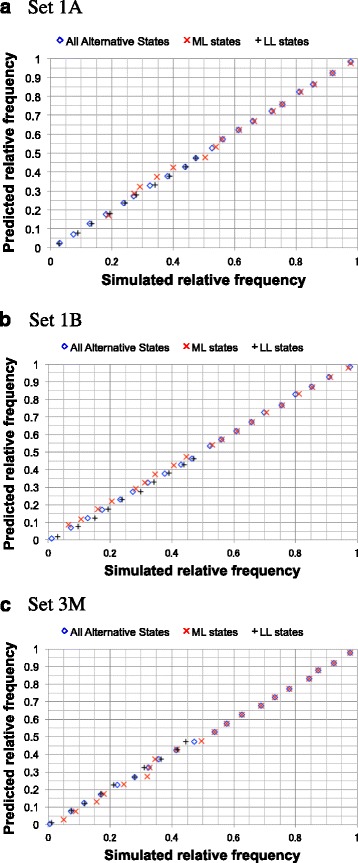
Fig. 7.

Simulation analyses on relative frequencies among local indel histories. Each panel compares the predicted relative frequencies (ordinate) against the actual relative frequencies in simulations (abscissa). The relative frequencies are among parsimonious local indel histories that potentially yield the same local MSA. A blue diamond, a red ‘X’ and a black cross represent a bin of all parsimonious local indel histories, that of most likely (ML) parsimonious histories, and that of least likely (LL) parsimonious histories, respectively. Panels a, b and c show the results with sets 1A, 1B and 3M, respectively. See section SM-8 in Additional file 1 for how the analysis was performed. Panels a and b are reformatted versions of panels D and E, respectively, of Figure 29 of [48]
