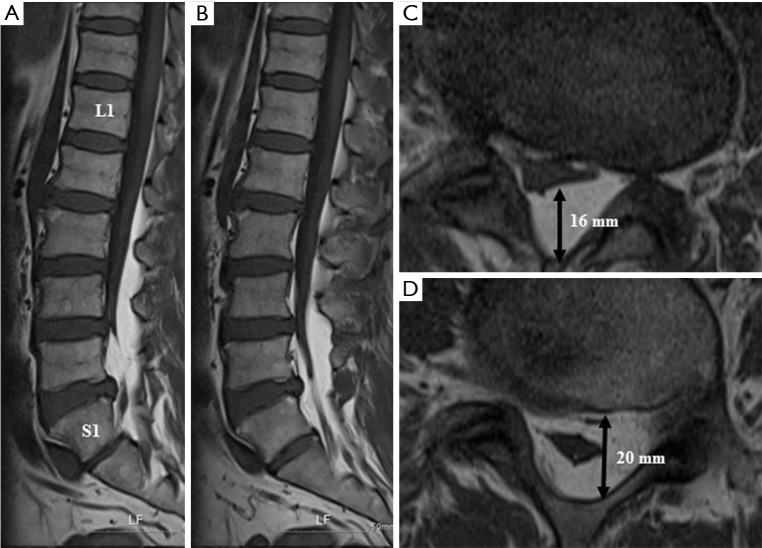
Figure 2.
Mid-sagittal (A) and para-sagittal (B) T1-weighted MR images reveal high-intensity adipose tissue mass in the spinal canal and circumferential epidural fat deposit from L1 lower level to S2. Axial T1-weighted MR images at L4/5 (C) and L5/S1 (D) level show the stellate sign. Each L4/5 and L5/S1 level adipose tissue measured 16 and 20 mm.

