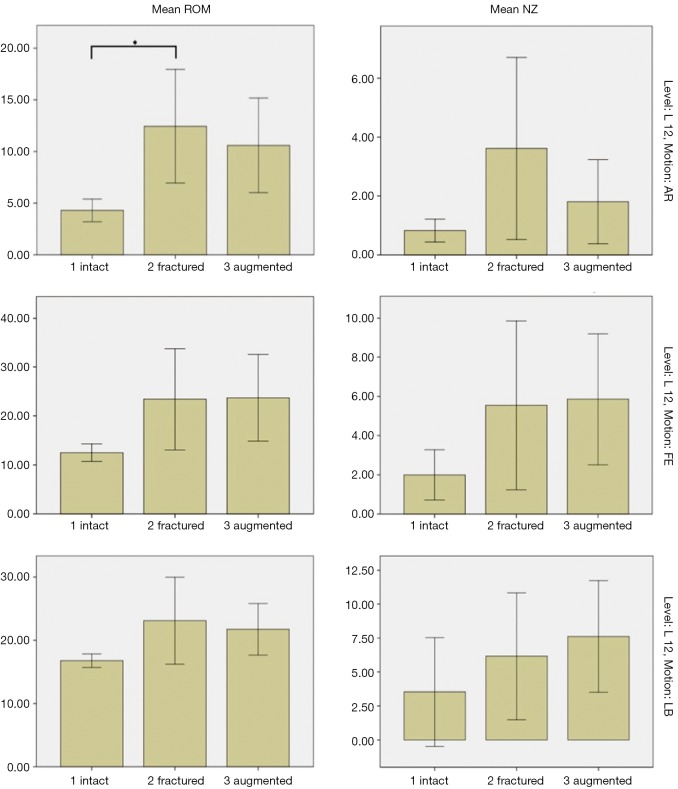
Figure 5.
Bar graphs showing mean range of motion (ROM) (left) and neutral zones (NZ) (right) of intact, fractured and augmented spines in axial rotation (AR), flexion/extension (FE) and lateral bending (LB) between levels L1-2. A statistically significant difference (*) in ROM was found between the intact and fractured states in AR.

