Fig. 1.

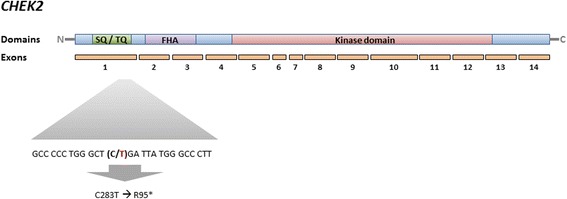
Schematic representation of the CHEK2 gene with details on the flanking region of the R95* mutation (in bold; C = reference allele, T = alternative allele)

Schematic representation of the CHEK2 gene with details on the flanking region of the R95* mutation (in bold; C = reference allele, T = alternative allele)