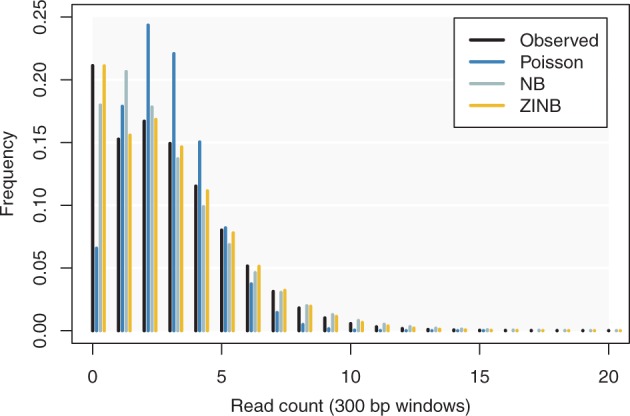
Fig. 1.

Using the ZINB distribution to model ChIP-seq data (color version of the figure available online). Reads from a mock control dataset were mapped onto the human genome and pooled in 300 bp windows after removing duplicates. The histogram of the read counts is shown in black (no immunoprecipitation was performed in this experiment, so this variation corresponds to the ‘baseline’). The colored histograms show the maximum likelihood fit of the Poisson, Negative Binomial (NB) and Zero-Inflated Negative Binomial (ZINB) distributions. The fit of the Poisson distribution is poor. The NB distribution gives a good fit at the tail, but not for windows with 0 and 1 read. The ZINB distribution gives a good fit over the whole range. Data from ENCODE file ENCFF000VEK (Color version of this figure is available at Bioinformatics online.)
