Fig. 6.

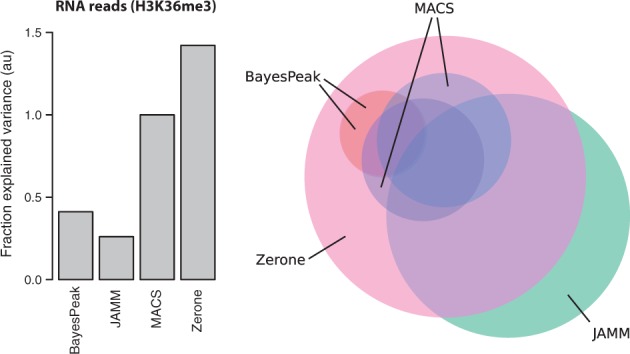
Left panel: quality of the H3K36me3 discretization. Each bar represents the relative fraction of variance in RNA reads explained by the discretization of H3K36me3. The value for MACS was set to 1.0 and all other values were scaled accordingly. Right panel: Overlap between H3K36me3 targets (color version of the figure available online). Each circle represents the H3K36me3 targets identified by a program. The size of the circles is proportional to the coverage of the targets, and their overlap approximates the amount of targets shared by the programs. Note that the discretizations made by BayesPeak overlap almost completely and are indistinguishable in this representation. Also note that JAMM is used ‘unthresholded’, as IDR is not recommended for broad signal (Color version of this figure is available at Bioinformatics online.)
