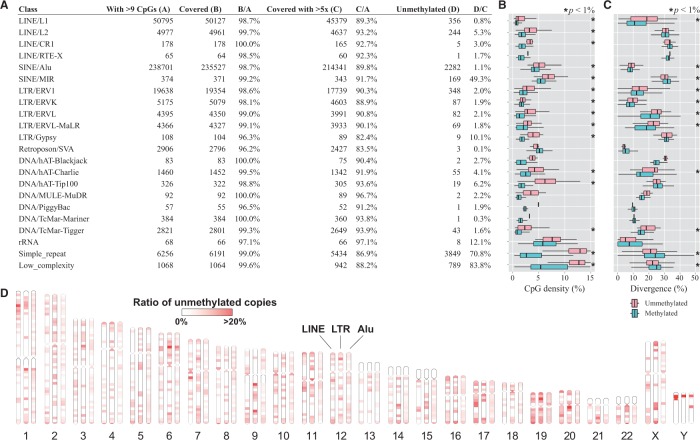
Fig. 3.
Epigenetic landscape of repetitive elements in the human genome. (A) The table shows a summary of methylation status on repetitive elements (REs) that we select using the Repeat Library 20140131 (Smit, A., Hubley, R. and Green, P. Repeatmasker open-4.0 at http://www.repeatmasker.org). (B, C) Distribution of CpG density (B) and sequence divergence from the representative in each repeat class (C) for methylated (lower box) and hypomethylated (upper box) repeat occurrences. The asterisks indicate statistical significance (P < 1%) determined by the U-test. (D) Genome-wide distribution of hypomethylated REs. The ratio of hypomethylated repeat occurrences to all occurrences in each 5-Mb bin is indicated by color shadings. We used the Ideographica web server to generate the image (Color version of this figure is available at Bioinformatics online.)

