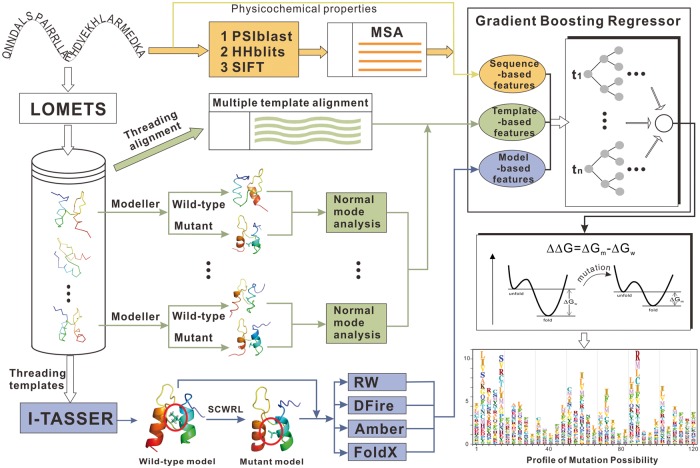
Fig. 3.
Flowchart of STRUM for mutation-induced stability change prediction. Three sources of features from sequences (orange lines), threading alignments (green), and I-TASSER models (blue) are trained by gradient boosting regression for prediction. The final output is an all-to-all table and a visible mutation profile specifying the mutation probability to different amino acids at each position

