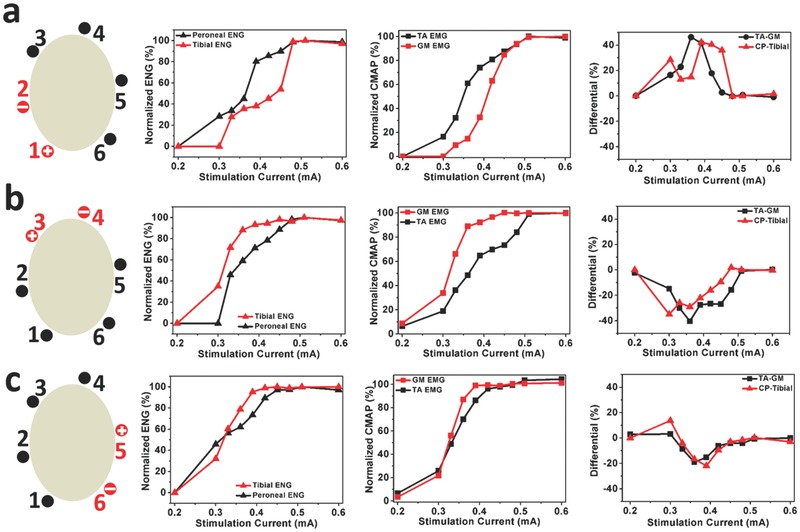
Figure 4.

Recorded ENG and EMG signals when stimulating different sets of contacts. When stimulating a) Contact 1 and Contact 2, b) Contact 3 and Contact 4, and c) Contact 5 and Contact 6, the plots (from left to right) show signals from the peroneal nerve (CP) and the tibial nerve, normalized EMG signals in the TA and GM muscles, and the difference in the ENG signals from the peroneal nerve and tibial nerve, as well as the difference in activation of the TA and GM muscles.
