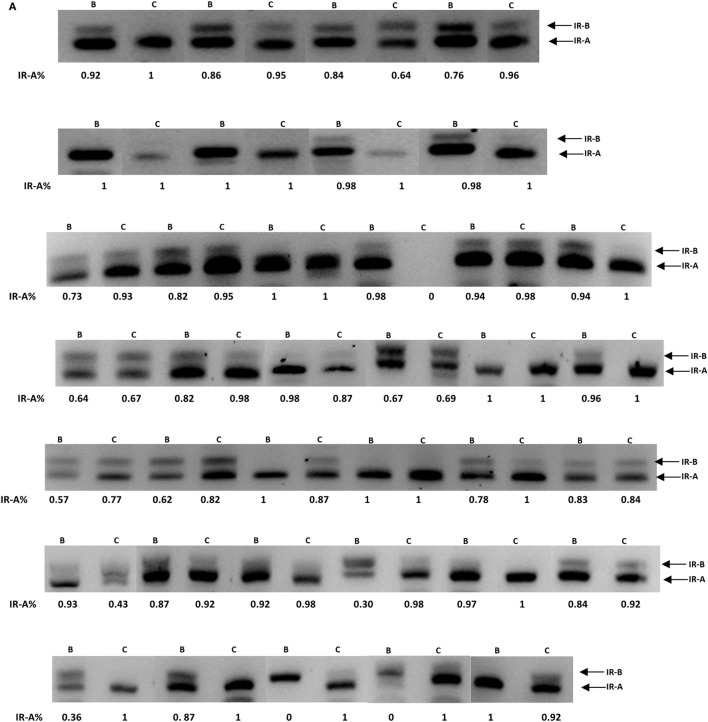
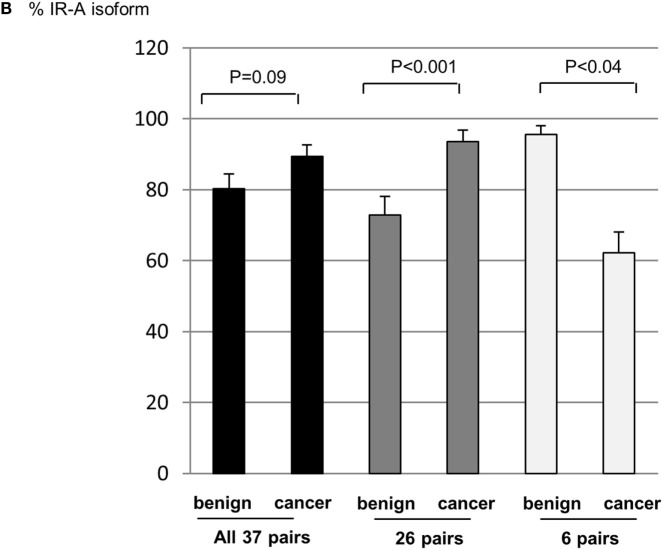
Figure 5.
(A) FFPE patient samples were collected from patients diagnosed with adenocarcinoma of the prostate. RT-PCR was used to assess the levels of the IR-A and -B isoforms. (B) Graph showing the percentage change in the IR-A isoform relative to IR-B. Error bars represent the SE of the mean, where p < 0.05 represents statistical significance. B, benign; C, cancer.


