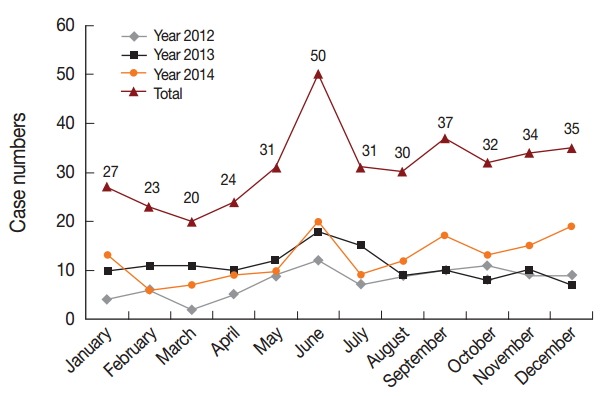
Fig. 6.

Monthly distributions of reported malaria cases, 2012-2014. Horizontal line shows 12 months and vertical line shows case numbers. The fold line of different colors show change trend of reported numbers monthly in the year 2012, 2013, 2014, and total, respectively. The joints of lines represent case numbers in current month.
