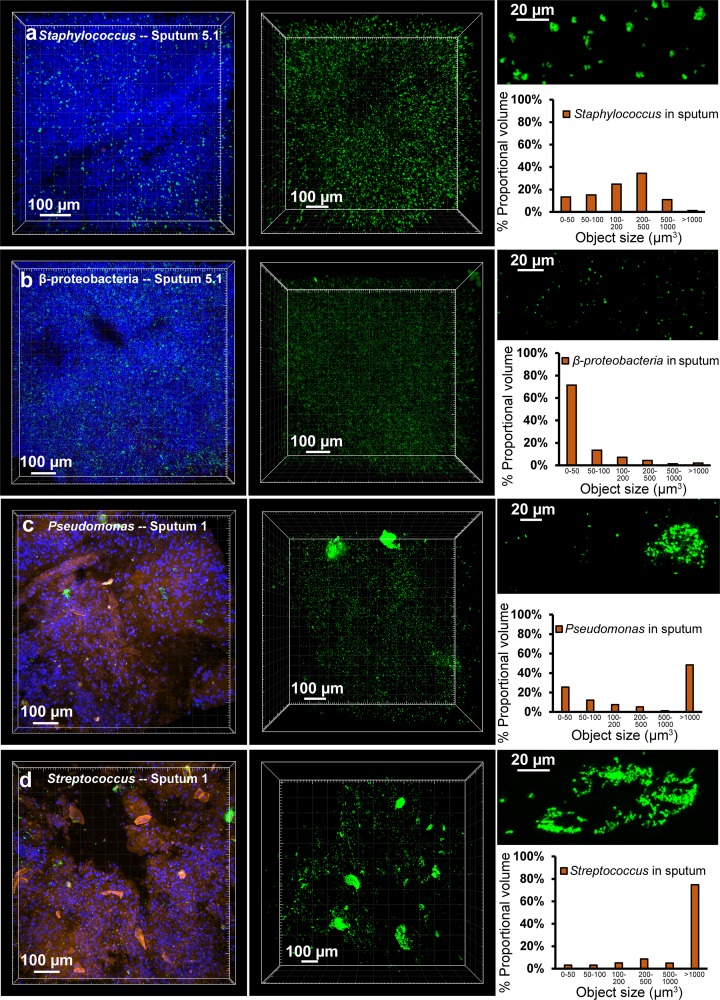
FIG 2 .
Aggregation patterns vary between species. (a) HCR with a Staphylococcus-specific probe in sputum sample 5.1 (green). The first panel is a maximum intensity projection of a Z-stack after HCR and staining with DAPI (blue) and WGA (orange), acquired with a 10× objective. The second panel is a maximum intensity projection of a separate Z-stack acquired with a 10× objective while only collecting HCR signal (Staphylococcus-specific probe mix with B4 amplifier and AlexaFluor 488-conjugated B4 hairpins) (7,910 objects analyzed). Each object identified in the second panel’s Z-stack was binned according to proportional object volume (each object’s fluorescent volume relative to the total fluorescent volume for that Z-stack; shown in the graph on the right). The top right panel is a maximum intensity projection of a Z-stack acquired with a 25× objective, highlighting a representative region from the same sputum sample. (b to d) The same analysis was applied to sputum 5.1 using a Betaproteobacteria-specific probe with B4 amplifier and AlexaFluor 488-conjugated B4 hairpin (21,255 objects analyzed) (b), to sputum 1 with a Pseudomonas-specific probe mixture with B4 amplifier and AlexaFluor 647-conjugated B4 hairpins (9,520 objects analyzed) (c), or a Streptococcus-specific probe mixture with AlexaFluor 488-conjugated B4 hairpins (4,603 objects analyzed) (d).

