
FIG 3 .
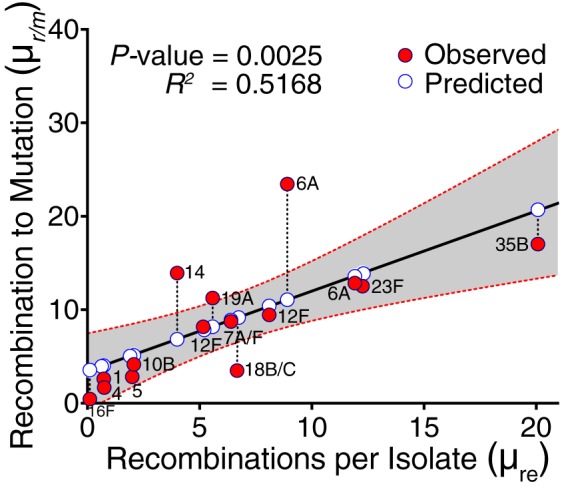
Relationship between rate and frequency of genetic recombination estimates in different S. pneumoniae serotypes. The solid red circles show the observed values, while the solid white circles show the estimated values by the univariate linear regression model. The dashed lines connecting the red circles to the white circles represent the residual, the difference between the observed and predicted values by the model. The gray band surrounding the regression line shows the 95% confidence interval (95% CI) for prediction of each data point in the horizontal axis. The two serotype 6A symbols in the figure originated from distinct clades, SC3 and SC9, as shown in Fig. 1 and Table 1.