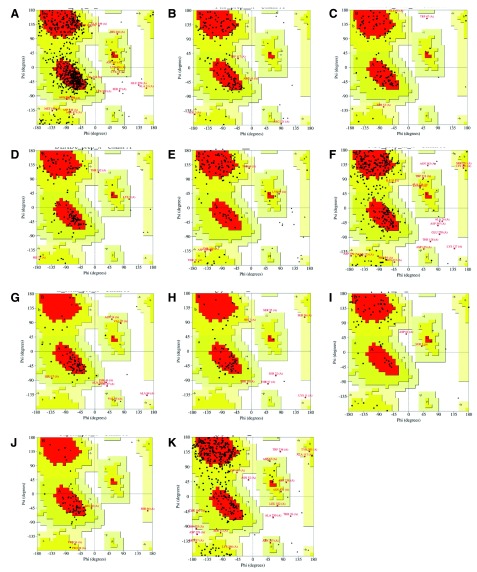
Figure 2.
Ramachandran plots for ZIKV NS5 ( A), FtsJ ( B), HELICc ( C), DEXDc ( D), Peptidase S7 ( E), NS1 ( F), E Stem ( G), Glycoprotein M ( H), Propeptide ( I), Capsid ( J), and Glycoprotein E ( K) obtained by PROCHECK, showing the dihedral angles Psi and Phi of amino acid residues. Red represents most favored regions; yellow represents additional allowed regions; beige represents generously allowed regions; and white areas are disallowed regions.

