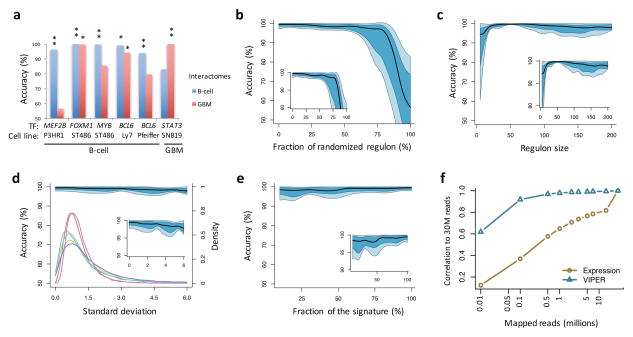
Figure 2. Effect of network and signature quality on VIPER results.
(a–c) Effect of network quality on VIPER accuracy (rank position of the silenced gene), including using a non tissue-matched interactome (a), network degradation by partially randomizing the regulons (b), or reducing the regulon size (c). (a) Barplot showing VIPER accuracy when computing protein activity with a B-cell interactome (blue) or glioma interactome (red). (b–c) Plots summarizing the accuracy across the six benchmark experiments by the median (black line), IQR (blue area), and the lowest and highest data points still inside 1.5 times the IQR away from the quartiles (light-blue area), resembling a box-and-whiskers plots (continuous boxplot). (d–f) Effect of gene expression signature quality on VIPER accuracy. (d) Signature degradation by addition of different levels of Gaussian noise (x-axis). VIPER accuracy (left y-axis) is shown by the continuous boxplot. The probability density plots show the distribution of gene expression variance for the six benchmark datasets (right y-axis). (e) Reduction of the signature coverage by randomly removing genes. VIPER accuracy is summarized by the continuous boxplot. (f) Robust response of VIPER-inferred protein activity signatures to low depth RNAseq data. Shown is the average correlation between 30 million (30M) mapped reads-based gene expression (yellow circles) or VIPER-inferred protein activity (cyan triangles) signatures, and the corresponding signatures computed from lower-depth RNAseq (indicated in the x-axis). The signatures were obtained from 100 breast carcinoma samples profiled by TCGA.

