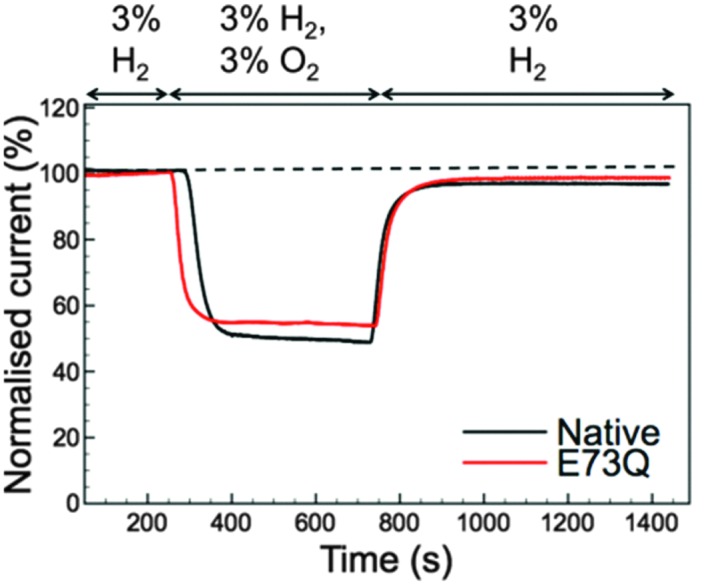
Fig. 3. Inhibition and recovery from 3% O2 measured at +0.113 V vs. SHE with 3% H2 throughout. The black line shows data for Native Escherichia coli Hyd-1 while the red line depicts the measurement for the E73Q variant. Other experimental conditions: pH 4.5; 37 °C; electrode rotation rate 3500 rpm; carrier gas N2 and total gas flow rate 100 scc min–1.

