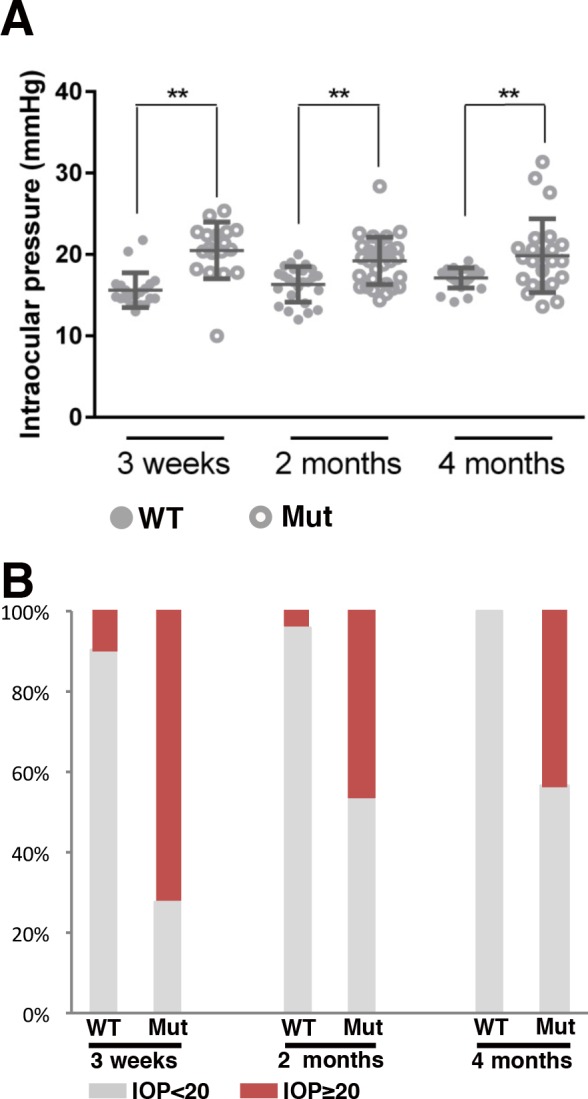
Figure 2.

Intraocular pressure analysis in the controls and Pitx2+/− mice. (A) Individual IOP values from the time points indicated were shown by dot plotting. Means ± SD are also included. Solid circles represent the values from wild type and hollow circles represent the values from Pitx2+/−. The mean of IOP values in control eyes was 15.62 (n = 20), 15.9 (n = 25), and 16.98 (n = 25) at 3 weeks, 2, and 4 months, respectively. The mean IOP values for Pitx2+/− eyes at 3 weeks, 2, and 4 months of age were 20.5 (n = 18), 18.8 (n = 32), and 20.1 (n = 23), respectively. ** indicates the difference is significant (P ≤ 0.01). (B) Intraocular pressure data are presented by stacked column plotting, showing the percentage of each group at different time points.
