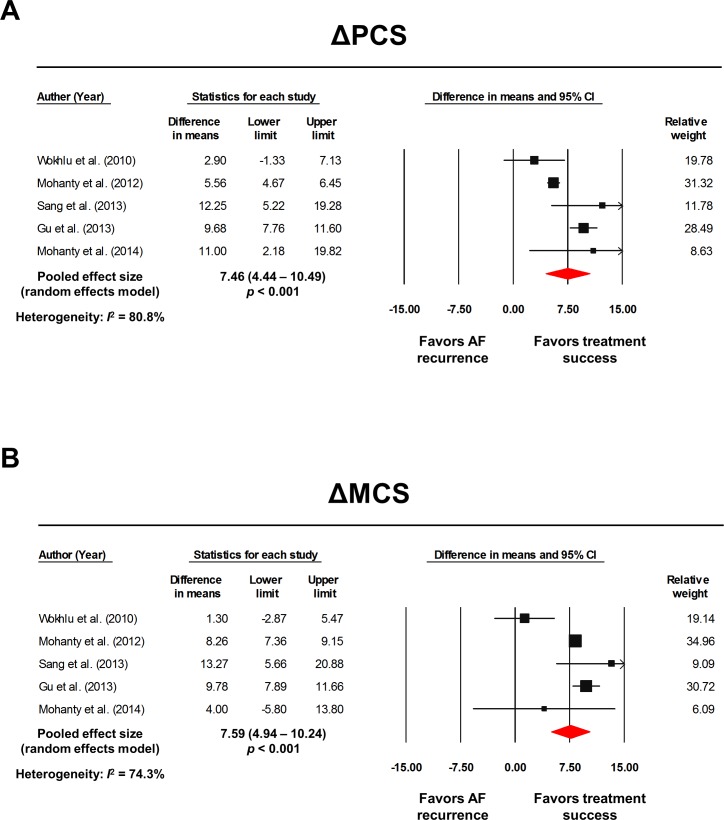
Fig 5. Forest plots: treatment success vs. AF recurrence.
The pooled WMD of ΔPCS (A) and ΔMCS (B) are presented. The size of the black squares corresponds to the weight of each study included. The overall effect size was calculated with a random effects model. The raw data extracted from each study are described in Table 4. AF: atrial fibrillation; CI: confidence intervals; MCS: mental component summary score; PCS: physical component summary score; WMD: weighted mean difference.

