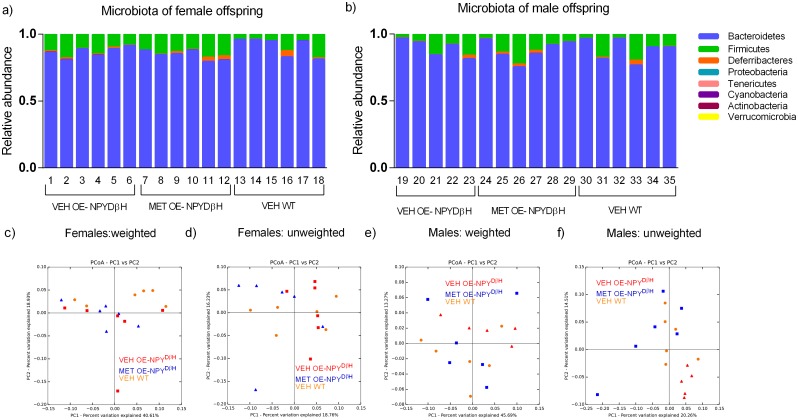
Fig 4. Composition of the gut microbiota.
Occupation of microbiota by 8 most prominent phyla in the VEH and MET exposed OE-NPYDβH and VEH exposed WT female and male offspring at 10–11 weeks (a,b). Weighted PCoA of the VEH OE-NPYDβH vs. MET OE-NPYDβH vs. VEH WT female offspring microbiota where principal coordinates PC1 explains 40.61% and PC2 18.93% of the total variance (c). Unweighted PCoA of the VEH OE-NPYDβH vs. MET OE-NPYDβH vs. VEH WT female offspring microbiota where PC1 explains 18.76% and PC2 16.23% of the total variance (d). Weighted PCoA of the VEH OE-NPYDβH vs. MET OE-NPYDβH vs. VEH WT male offspring microbiota where PC1 explains 45.69% and PC2 13.27% of the total variance (e). Unweighted PCoA of the VEH OE-NPYDβH vs. MET OE-NPYDβH vs. VEH WT male offspring microbiota where PC1 explains 20.26% and PC2 14.51% of the total variance (f). Red squares and triangles = VEH OE-NPYDβH female (n = 6) and male (n = 5) offspring, respectively; blue triangles and squares = MET OE-NPYDβH female (n = 6) and male (n = 6), offspring, respectively; orange circles = VEH WT female (n = 6) and male (n = 6) offspring. Plots produced by Qiime.

