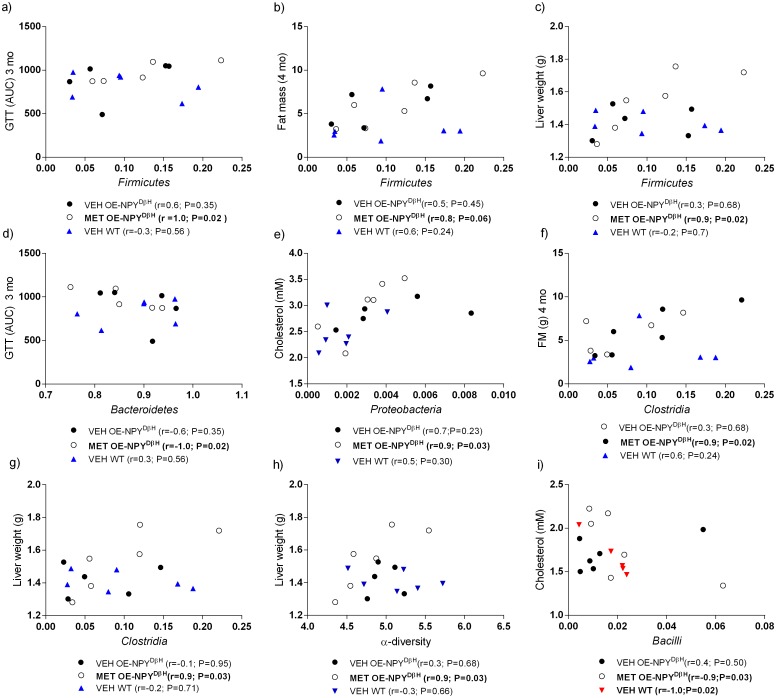
Fig 6. Correlation of gut microbiota composition to metabolic parameters.
Correlation of the abundance of Firmicutes with GTT at 3 months (a), fat mass at 4 months (b), liver weight at 7 months (c), Bacteroidetes with GTT at 3 months (d), Proteobacteria with cholesterol at 7 months (e), Clostridia with fat mass at 4 months (f) and liver weight at 7 months (g) and α-diversity with liver weight at 7 months (h) in the VEH OE-NPYDβH (n = 5), MET OE-NPYDβH (n = 6) and VEH WT male (n = 6) offspring. Correlation of the abundance of Bacilli with serum cholesterol at 7 months (i) in the VEH OE-NPYDβH (n = 6), MET OE-NPYDβH (n = 6), and VEH WT (n = 6) female offspring. Black circles = VEH OE-NPYDβH, open circles = MET OE-NPYDβH, red and blue triangles = WT female and male offspring, respectively. P-values and r by Spearman correlation.

