
Figure 2.
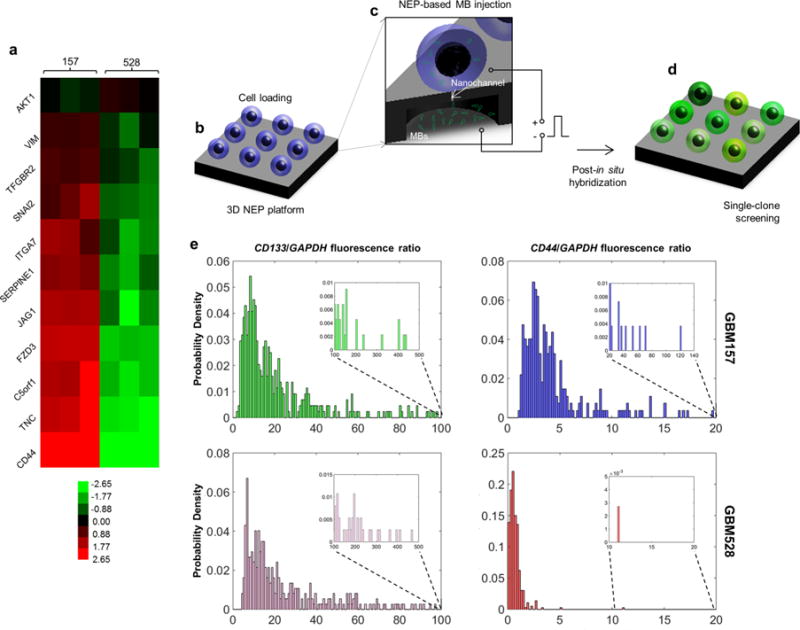
Large-scale screening of GSCs revealing of significant variations across and within (single-cell resolution) populations. (a) Microarray data showing that GBM157 tend to overexpress migration-related genes compared to GBM528. (b–d) Large-scale single-cell screening based on 3D NEP. (b) GSCs are first loaded on the chip surface. (c) Molecular beacons are then delivered into each cell by applying a focused, pulsed electric field through arrayed nanochannels. (d) Following in situ hybridization, the cells show varying levels of fluorescence depending on the expression level of the target gene. (e) Single-cell fluorescence is then quantified via fluorescence microscopy. The results show that both the GBM157 and GBM528 populations reveal similar levels of expression for CD133, which is a proneural GSC marker. CD44 expression was more pronounced for the GBM157 population, with a number of clones showing markedly higher expression (inset) compared to the rest of the population. Such clones are presumed to exhibit more aggressive behavior.