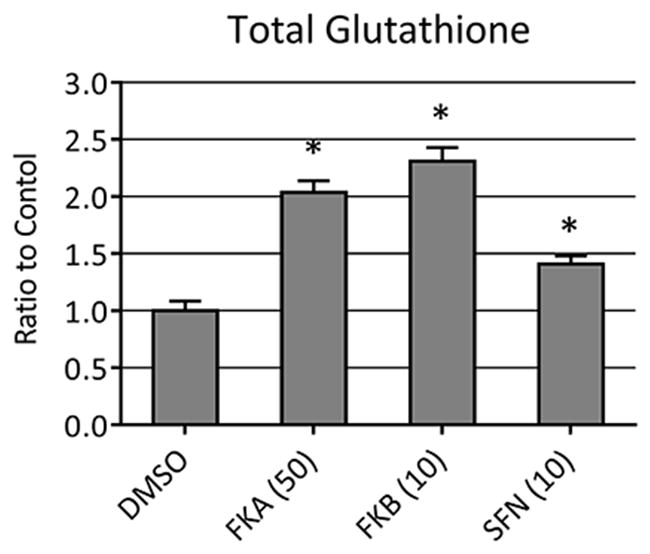
Figure 4.

Total glutathione levels in HepG2 following 24 h treatment with 0.1% DMSO (vehicle control), 50 μM FKA, 10 μM FKB, or 10 μM SFN. Data are represented relative to total GSH + GSSG in vehicle-treated cells. Error bars indicate standard deviations (n = 8, *p < 0.05).
