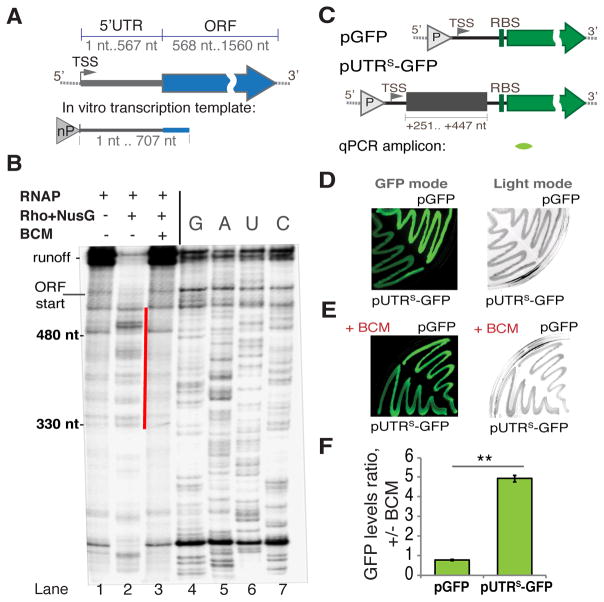
Figure 2. Rho-dependent Termination within the rpoS 5′UTR.
(A) A diagram of E. coli rpoS with its 5′UTR and ORF indicated. A genome-derived template for in vitro transcription (B) that includes the entire rpoS 5′UTR and the first 140 nt of ORF is depicted below, “nP” indicates the location of the native promoter driving rpoS transcription. TSS - transcription start site.
(B) A representative single round transcription (6% TBE-UREA gel) on the rpoS template (see A). Pre-formed elongation complexes were chased without (lane 1) or with Rho and NusG (without BCM - lane 2; with BCM - lane 3). Gel densitometry indicates that the efficiency of termination without BCM is ~87% (see also Figure S3). The most prominent termination products are marked with the red line. To determine the location of termination sites RNA sequencing was performed using 3′ dNTPs (lanes 4–7). The beginning of ORF and runoff are indicated.
(C) Reporter constructs. Upper panel: pGFP construct with the GFP reporter only. Lower panel: the transcriptional fusion pUTRS-GFP used to test the effect of the rpoS 5′UTR (fragment +251–447 nt) on Rho termination (see also Figure S2A). “P” indicates the location of a constitutive promoter. TSS – the transcription start site; RBS – the ribosome-binding site. The location of qRT-PCR amplicon is indicated below (green).
(D and E) Representative results from the GFP plate assay. DH5a cells transformed with pGFP or pUTRS-GFP grew on LB agar plates without (D) or with 8 μg/ml BCM (E) and the fluorescence intensity was measured (GFP mode, left panel). The same plates were also captured under visible light (Light mode, right panel).
(F) qRT-PCR data for exponentially growing cells transformed with pGFP or pUTRS-GFP. Ratio of gfp RNA levels +/− BCM is plotted. Values are means ±SD, n = 3; ** P < 0.01 (Student’s t-test, equal variance).

