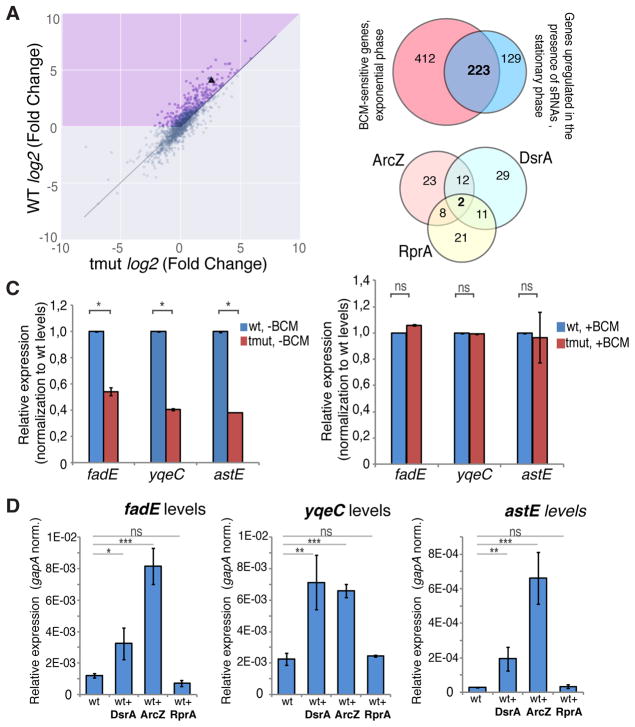
Figure 7. sRNA-mediated Antitermination is a Global Phenomenon.
(A) Scatter plot of gene expression changes upon transition to the stationary phase (log2 Fold Change) in the wild type (WT) vs triple sRNAs deletion mutant. Differential gene expression analysis was performed using the DESeq2 software package for stationary vs exponential phase. Only the genes with long (>80 nt) 5′UTRs are shown. rpoS is marked by a triangle. The purple shaded area indicates genes with a greater upregulation during stationary phase in wt cells than in the sRNAs mutant strain.
(B) Upper panel: Venn diagram shows the overlap between the long leader genes upregulated in the exponential phase due to BCM treatment and those, which upregulation in the stationary phase depends on DsrA, RprA and ArcZ. Lower panel: Venn diagram shows the predicted sRNA target distribution in the 223 genes, which regulation depends on both Rho and mentioned sRNAs.
(C) Transcript levels of fadE, yqeC and astE in the wt and sRNAs triple deletion mutant (tmut) measured in stationary phase in the absence (left) or presence of BCM (right). qRT-PCR data with normalization against corresponding wt strain gene levels. Values represent means ±SD, n = 3; * P < 0.05; ns, not significant (Student’s t-test, equal variance).
(D) Transcript levels of fadE, yqeC and astE in the exponentially grown wt cells with or without overexpression of DsrA, ArcZ and RprA. qRT-PCR values are normalized to that of a housekeeping gapA gene. Values represent means ±SD, n = 3; ** P < 0.01, *** < 0.001, ns - not significant (Student’s t-test, equal variance).

