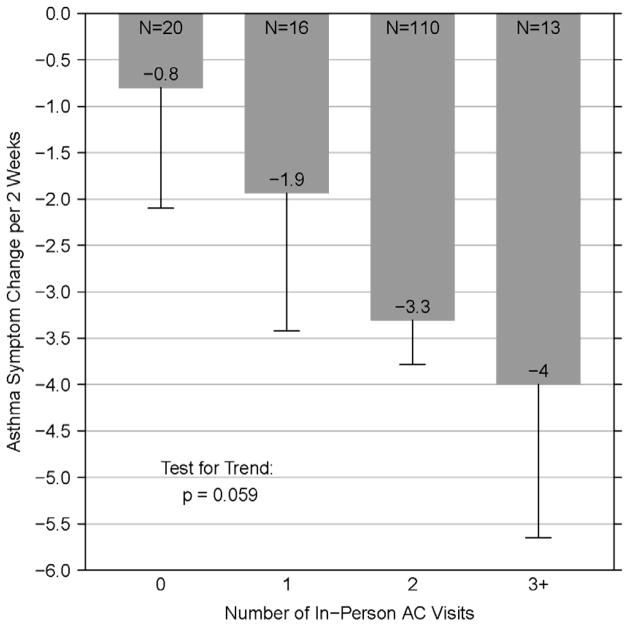
Figure 3. AC Visits and Asthma Symptom Reduction.
AC Visits and Asthma Symptom Reduction: Bars and annotated numbers represent the mean change in maximum symptom days over 12 months. Error bars represent standard error. N represents the number of participants with a 12-month symptoms outcome via phone for the corresponding number of in person AC visit(s). Test for trend p-value is annotated on the plot.

