Figure 1.

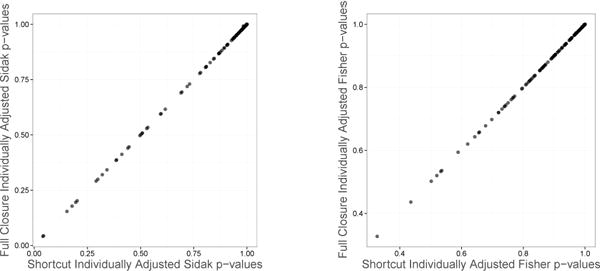
Correspondence between individually adjusted p-values using the full closure algorithm and the computational shortcut (L = 10). The Šidák p-values are illustrated in the left panel, and the Fisher p-values in the right panel.

Correspondence between individually adjusted p-values using the full closure algorithm and the computational shortcut (L = 10). The Šidák p-values are illustrated in the left panel, and the Fisher p-values in the right panel.