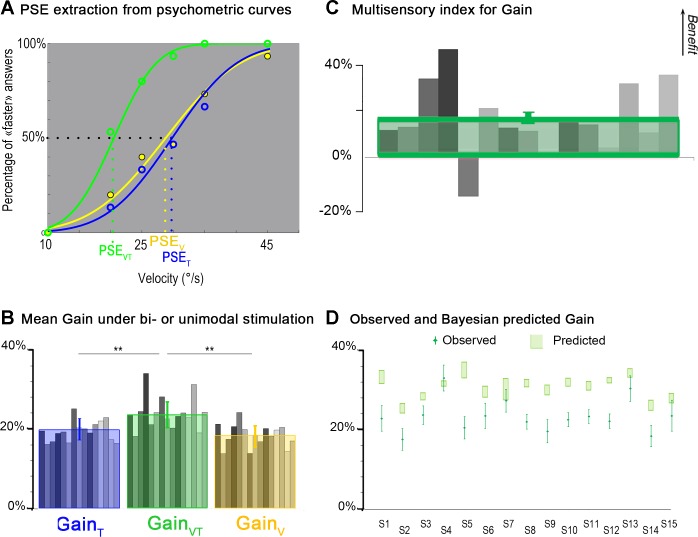
Fig. 6.
Comparison of the gains of the perceptual responses during tactile, visual, and visuo-tactile stimulation. A: extraction of the PSE from psychometric curves. Psychometric curves of one participant obtained by fitting the probability of perceiving the illusion as “faster than the reference” movement with a cumulative Gaussian distribution for the tactile stimulation (T; blue curve), visual stimulation (V; yellow curve), and visuotactile stimulation (VT; green curve) is shown. The PSE corresponds to the stimulation velocity leading to the faster than the reference answer 50% of the time. B: mean gain in bi- or unimodal stimulation. Mean individual values of gain (gray bars) and mean (±SD) values of gain calculated as the ratio between Vref and the actual velocity of the visual (yellow bars), tactile (blue bars), and visuotactile (green bars) stimulation at the PSE are shown. For the mean gain values, significant differences were found between the bimodal and each of the two unimodal conditions (*P < 0.05; **P < 0.01). C: multisensory index for gain. Individual (gray bars) and mean multisensory index (green square) of illusion gains (N = 15 participants) are shown. Positive and negative values correspond, respectively, to a multisensory increase or decrease in the gain of the perceptual illusions of the participants with respect to the best unimodal performance. D: comparison between observed and Bayesian-predicted gain. A comparison between observed gain in visuotactile stimulation and gain predicted by the Bayesian model with a zero-centered prior for the 15 participants (S1 to S15) is shown. The green diamonds correspond to the observed data, and error bars are SDs. The increase of the bimodal gain was predicted but overestimated by the model. Light green rectangles represent 95% CIs computed using the following bootstrap procedure. Choice data were resampled across repetitions (with replacement) and refitted 1,000 times to create sample distributions of the threshold for each psychometric function and for the predicted visuotactile parameters. The CIs were directly estimated from these bootstrap samples (percentile method).

