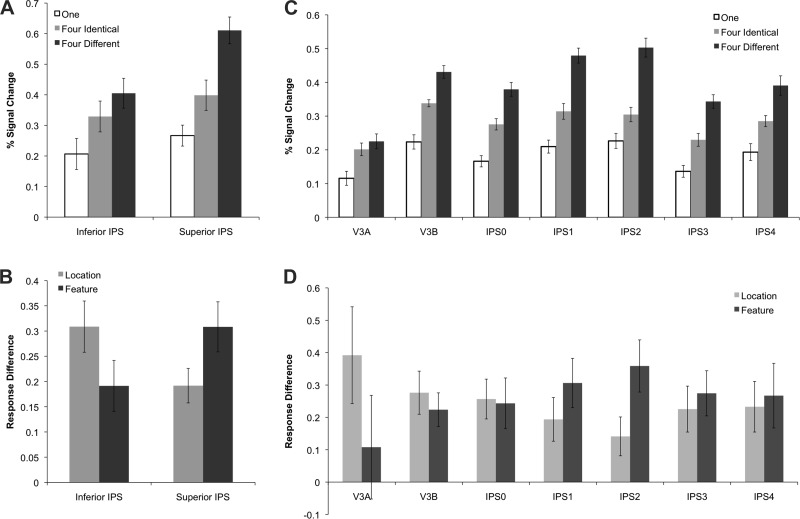
Fig. 4.
Activity for each condition in the main VSTM experiment in superior and inferior IPS (A), along with the normalized response difference (see materials and methods) showing location-based processing (4 identical objects minus 1 object) and featural-based processing (4 different objects minus 4 identical objects) (B). The same is also shown for the IPS topographic regions (C and D). The strength of location-based processing was stronger in inferior than superior IPS, and the reverse was true for feature-based processing. Similarly, along the IPS topographic regions, there seemed to be a shift in the balance of location vs feature-based processing from a location bias in the lower IPS regions V3A, V3B, and IPS0 to a feature bias in higher IPS regions IPS1 and IPS2. Error bars indicate means ± SE.

