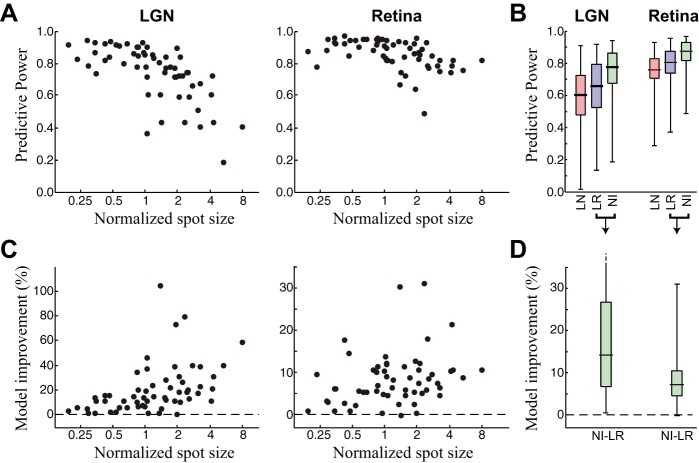
Fig. 3.
Model performance across spot size. A: predictive power of the NIM fit separately to each spot size and neuron for the retina and LGN. Note that performance is high (generally >80%) across all neurons but decreases more for the LGN than for RGCs. B: box plots showing the distributions of model performances for the LN, LR, and NI models across all neurons and spot sizes. C and D: percent model improvement between the NI and LR models for the same data shown in A and B, respectively. All increases are highly significant.

