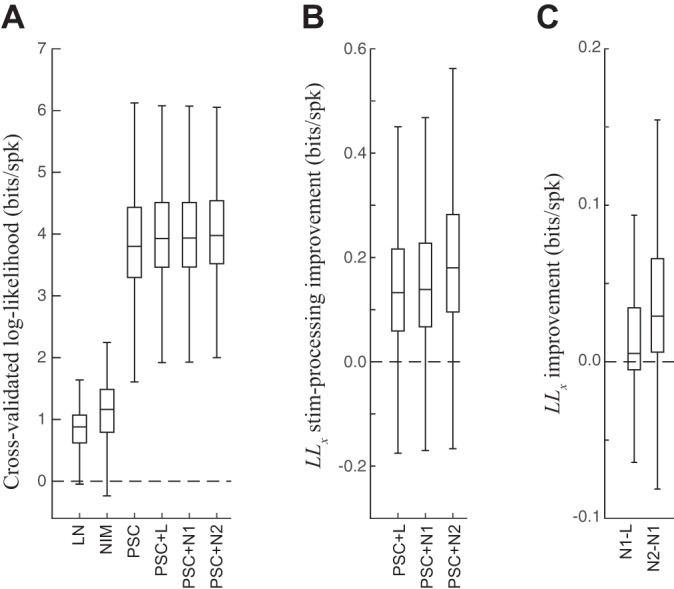
Fig. 7.

PSC model performance. A: cross-validated log-likelihood (LLx) for all LGN neurons and spot sizes, across all the models considered for the LGN neuron. The LN and NI models do not use S-potential input (e.g., Fig. 2); the PSC models are as follows: PSC alone is without any stimulus processing terms, +L is with a linear stimulus processing term, +N1 is with PULL suppression, and +N2 is with PULL and PUSH suppression. Notably, the PSC-based models all have much larger LLx because of their ability to predict the precise timing of the LGN spikes due to the S-potential inputs. Relatively speaking, the additional enhancements of the stimulus-processing terms to the PSC models were small but statistically significant (see below). B: the difference in LLx (“stim-processing improvement” in bits/spike; equivalent to the logarithm of the likelihood ratio) between the PSC models with stimulus terms and the baseline PSC model. All comparisons are statistically significant (t-test), both when each neuron is considered separately and when all neurons are considered together. C, left: LLx difference between PSC+N1 and PSC+L across neurons (all significant for all neurons, t-test). Right, the difference between PSC+N2 and PSC+N1. Comparisons were significant for all but 4 neurons (and otherwise P < 10−6).
