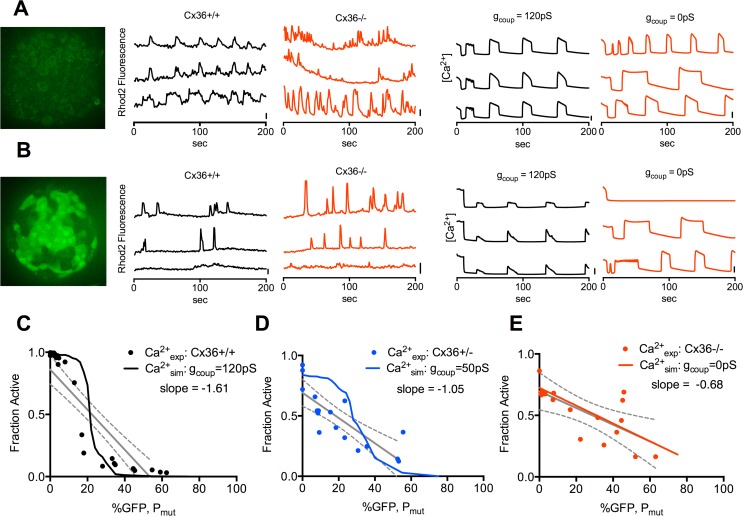
Fig 1. Calcium imaging and modeling in islets with varying Cx36 and Kir6.2[ΔN30,K185Q] expression.
A). Image of autofluorescence in GFP channel in islet lacking Kir6.2[ΔN30,K185Q] expression (left); with representative time courses of Rhod2 fluorescence in islets isolated from Cx36+/+ and Cx36-/- mice at 20mM glucose (middle); and time courses from simulations representing Cx36+/+ (gcoup = 120pS) and Cx36-/- (gcoup = 0pS) islets at 20mM glucose (right). Scale bars represent 20% increase in Rhod2 fluorescence or 20% increase in simulated [Ca2+] respectively. B). As in A, for islets with ~50% Kir6.2[ΔN30,K185Q] expression, as indicated by GFP fluorescence; or simulated to have ~50% Kir6.2[ΔN30,K185Q] expression. C). Quantification of [Ca2+], as expressed by the fraction of cells showing significant [Ca2+] elevations, in islets from Cx36+/+ mice with increasing Kir6.2[ΔN30,K185Q] expression (pr with linear regression (solid grey line, dashed grey lines indicate 95% CI.); together with corresponding simulation results with gcoup = 120pS (solid black line). D). As in C, for islets from Cx36+/- mice and simulation results with gcoup = 50pS. E). As in C, for islets from Cx36-/- mice and simulation results with gcoup = 0pS. Each data point in C-E represents an average over n = 2–5 islets per mouse, with a total of N = 24 mice (Cx36+/+), 19 mice (Cx36+/-) or 22 mice (Cx36-/-).

