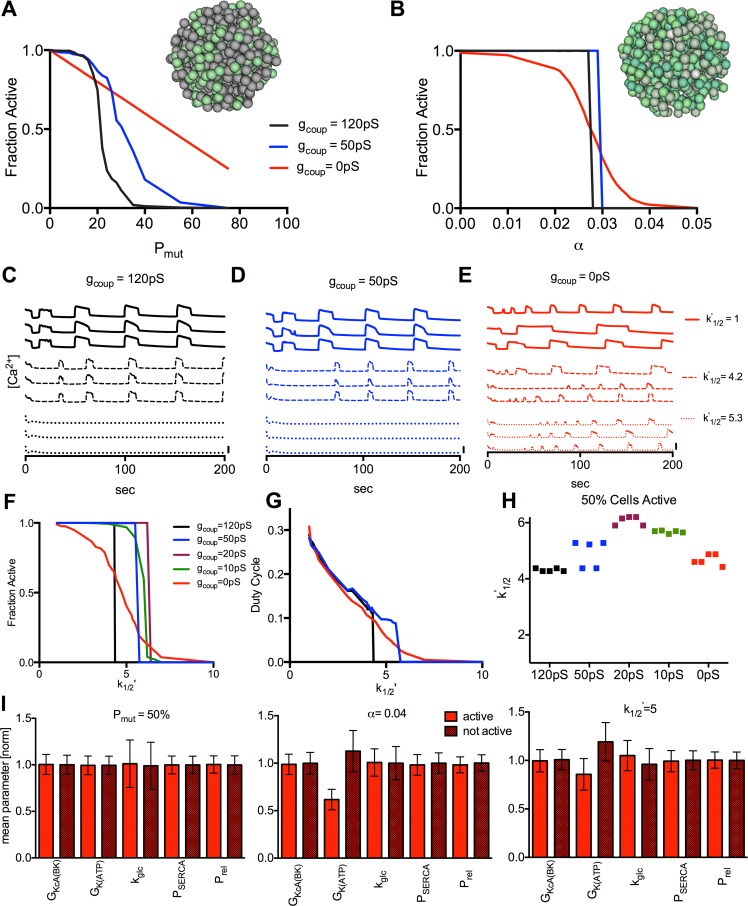
Fig 3. Simulated dependence of islet [Ca2+] on electrical coupling upon reduced KATP ATP sensitivity.
A). Quantification of [Ca2+], as expressed by the fraction of cells showing significant [Ca2+] elevations, for simulations of Kir6.2[ΔN30,K185Q] expression in a percentage of cells (PMut), at 20mM glucose, with gcoup = 120pS (black), 50pS (blue), and 0pS (red). Inset represents islet where specific cells show increased KATP activity modelling mosaic Kir6.2[ΔN30,K185Q] expression (green). B). Fraction of cells showing significant [Ca2+] elevations for simulations of diazoxide application uniformly in all cells (α) at 11mM glucose, Pmut = 1, with gcoup as in A. Inset represents islet where cells show variable KATP activity modelling intrinsic heterogeneity (green). C). Representative time courses from simulations with increased k’1/2 values (reduced ATP-sensitivity) as indicated, far left for gcoup = 120pS. D). As in C for gcoup = 50pS. E). As in C for gcoup = 0pS. Scale bars represent 20% increase in simulated [Ca2+]. F). Fraction of cells showing significant [Ca2+] elevations for increased k’1/2 values uniformly in all cells at 11mM glucose, Pmut = 1, for gcoup = 120pS (black), 50pS (blue), 20pS (purple), 10pS (green), and 0pS (red). G). Mean [Ca2+] duty cycle for increased k’1/2 values as in F. H). k’1/2 value at which 50% of cells show significant [Ca2+] elevations for values of gcoup over 5 simulated islets. I). Mean±SD cell parameters for active and inactive cells at gcoup = 0pS for simulations in A (Pmut), B (α), F (k’1/2). All data is representative of n = 5 simulations with different random number seeds.

