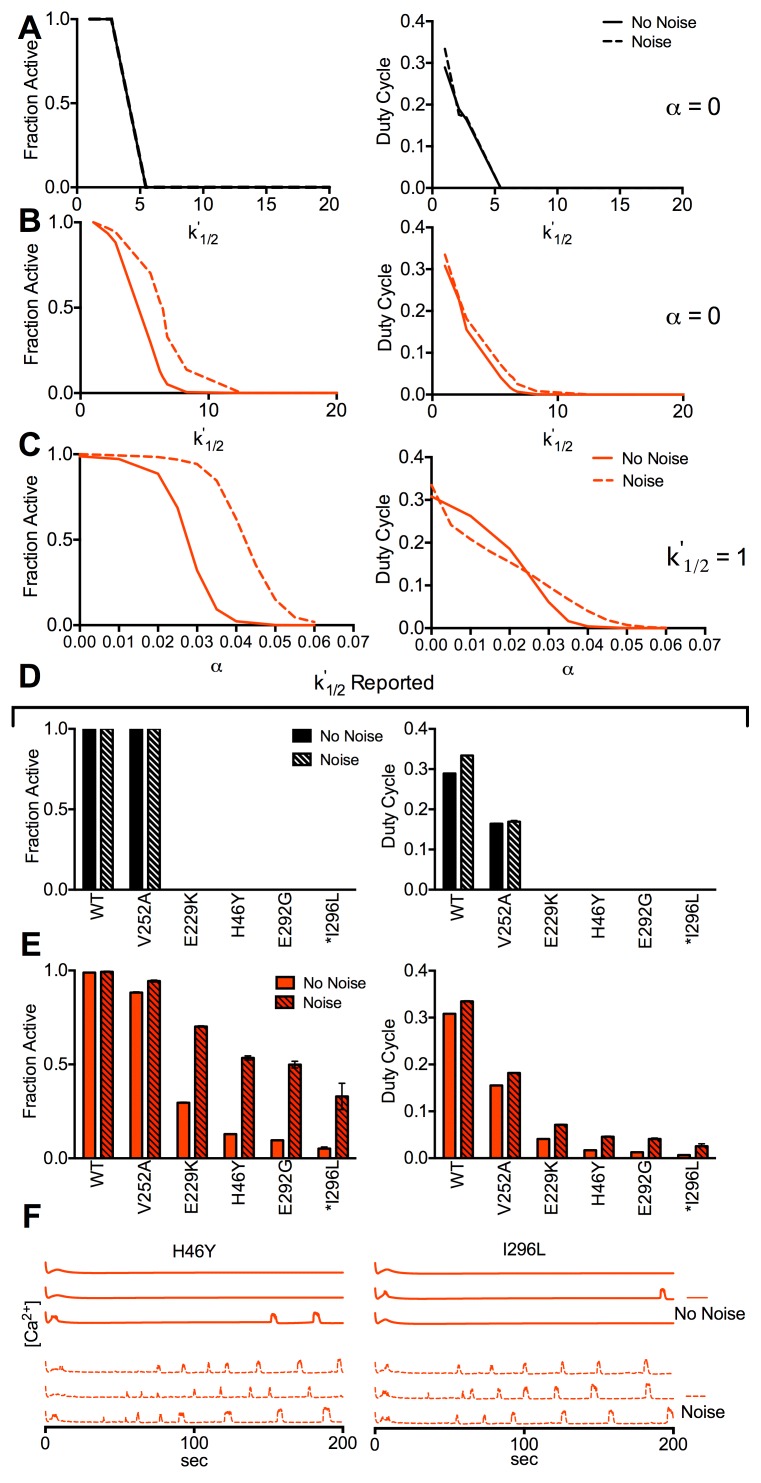
Fig 7. Simulated effect of stochastic channel noise upon Kir6.2 and SUR1 mutations.
A). Fraction of cells showing significant [Ca2+] elevations (left) and mean [Ca2+] duty cycle (right), for simulations with and without stochastic channel noise, for increasing k’1/2 with gcoup = 120pS (α = 0). B). As in A for increasing k’1/2 with gcoup = 0pS (α = 0). C). As in A for increasing α with gcoup = 0pS (k’1/2 = 1). D). Fraction of cells showing significant [Ca2+] elevations (left) and mean [Ca2+] duty cycle (right), for simulations with and without stochastic channel noise, that include mutant KATP channel activity for gcoup = 120pS. Simulations include the characterized mutations indicated where reported k’1/2 changes and reported α (if any) are accounted for. E). As in D for simulations with and without stochastic channel noise, that include mutant KATP channel activity for gcoup = 0pS. F). Representative time courses for simulations as in E, with and without stochastic channel noise for gcoup = 0pS. Vertical scale bars represent 20% increase in simulated [Ca2+]. All simulations were run at 11mM glucose, Pmut = 1. Data in D,E is presented as mean±SD for n = 3–5 simulations with different random number seeds.

