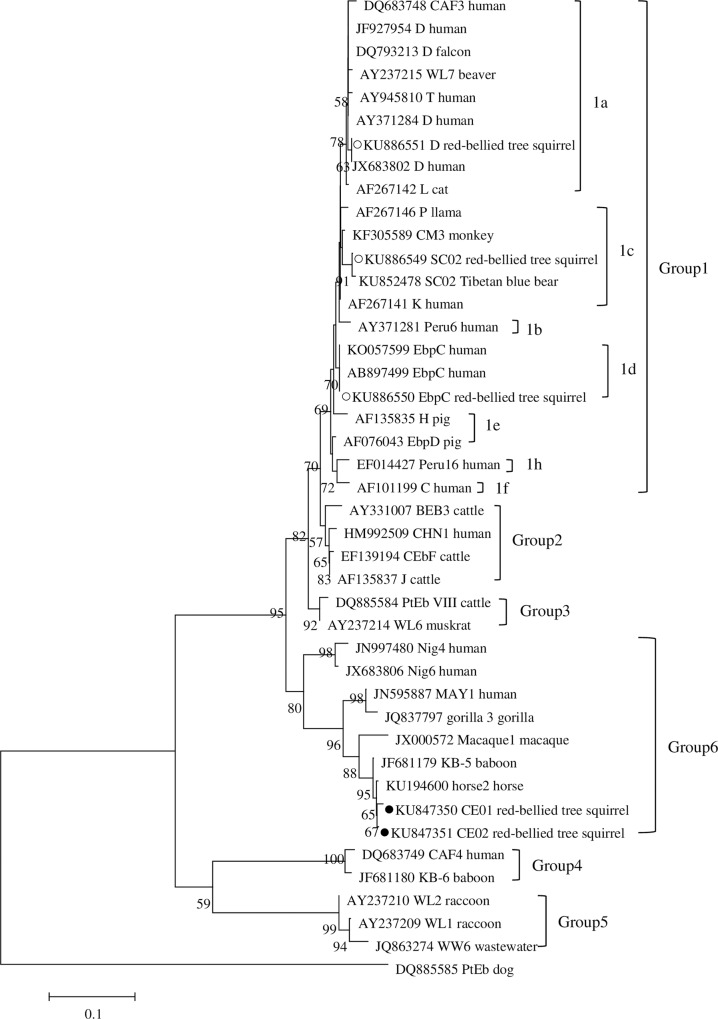
Fig 1. Phylogenetic relationship of Enterocytozoon bieneusi groups, the relationship between E. bieneusi genotypes identified in this study and other known genotypes deposited in the GenBank was inferred by a neighbor-joining analysis of ITS sequences based on genetic distance by the Kimura-2-parameter model.
The numbers on the branches represent percent bootstrapping values from 1,000 replicates, with more than 50% shown in tree. Each sequence is identified by its accession number, genotype designation, and host origin. The group terminology for the clusters is based on the work of Zhao et al [28]. Genotypes with black circles and open circles are novel and known genotypes identified in this study, respectively.

