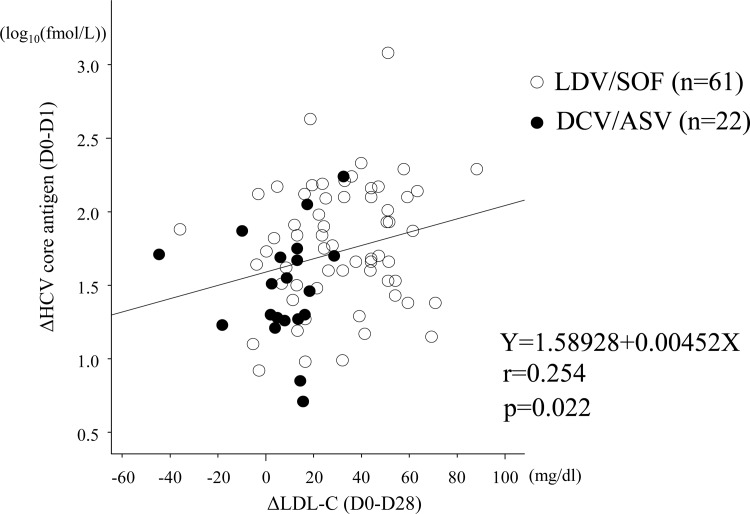
Fig 3. Correlation between ΔLDL-C (D0-D28) and ΔHCV core antigen (D0-D1).
Scatterplots with fitting line show positive correlation between ΔLDL-C and ΔHCV core antigen. Pearson’s correlation provides coefficient (r) and p-value. Open circles: the LDV/SOF patients. Closed circles: the DCV/ASV patients.

