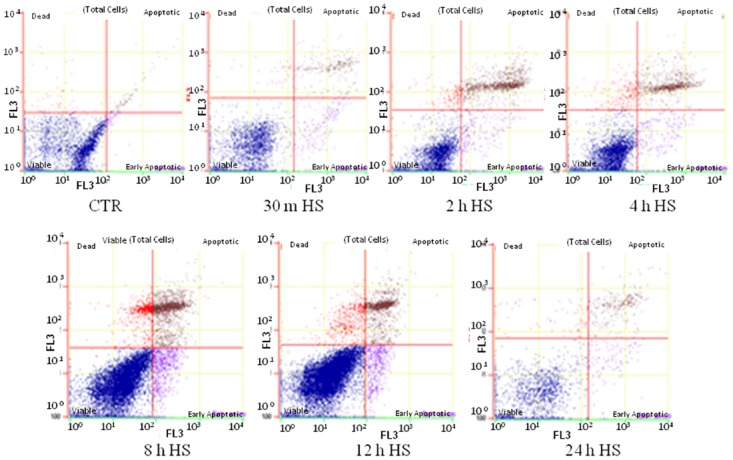
Fig 6. Evaluation of cellular apoptosis based on flow cytometric analysis in unstressed (CTR) and heat stressed (HS) buffalo MECs using Annexin FITC/7-AAD dyes.

For each graph, the quadrants display distribution of viable (bottom left), early apoptotic (bottom right), apoptotic (upper right) and dead (upper left) cells.
