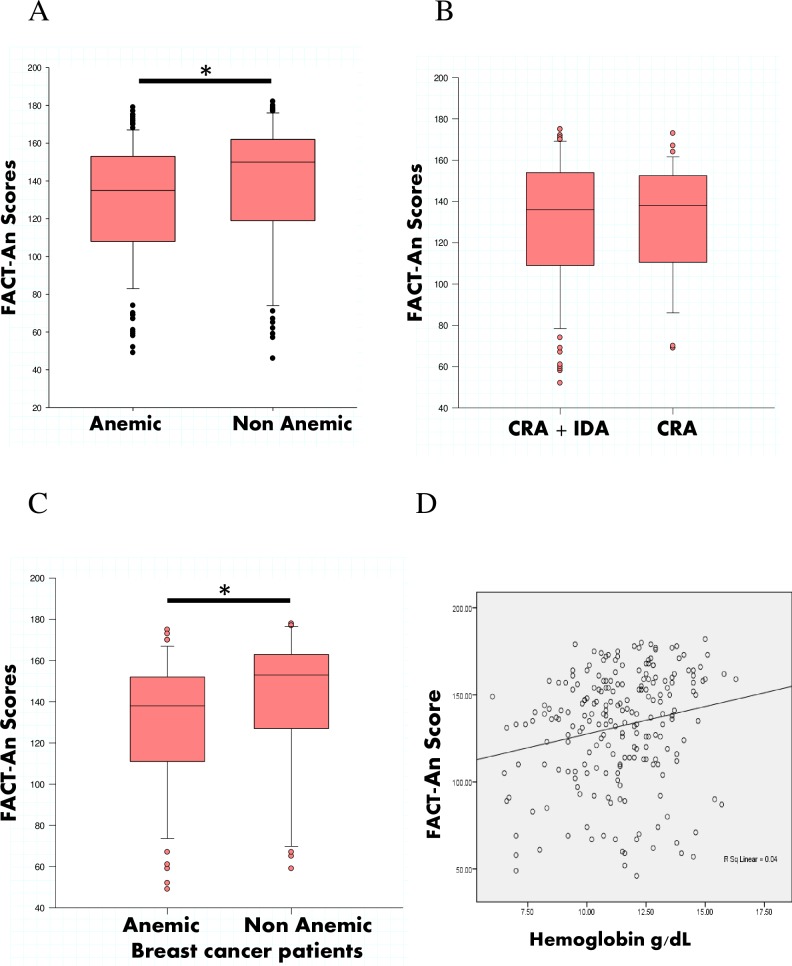
Fig 3. Correlation analysis as well as FACT An scores in anemic and non-anemic cancer patients.
(A) FACT-An scores were compared between anemic (n = 139) and non anemic cancer patients (n = 79), * p< 0.05 compared with anemic group. (B) FACT-An scores was compared between CRA+ IDA (n = 83) patients and only CRA (n = 38) patients. (C) FACT-An Scores were compared between anemic (n = 52) and non anemic breast cancer patients (n = 33), * p< 0.05 compared with anemic breast cancer patients. (D) Spearman correlation was used to correlate Hb levels and FACT-An scores. Correlation coefficient was ρ = 0.21; p = 0.001.

