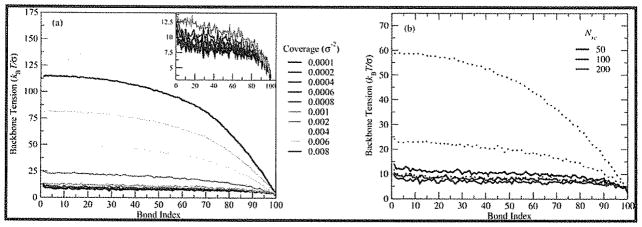
Figure 3.
Average backbone tension vs bond index (a) for 100:100 for ten values of Σ. Inset: backbone tension vs bond index for coverages Σ ≤ 0.001 bottle-brushes/σ2. (b) Average backbone tension vs bond index for Nbb = 100 at three different values of Nsc for Σ = 0.0002 bottle-brushes/σ2 (solid lines) and 0.002 bottle-brushes/σ2 (dotted lines).

