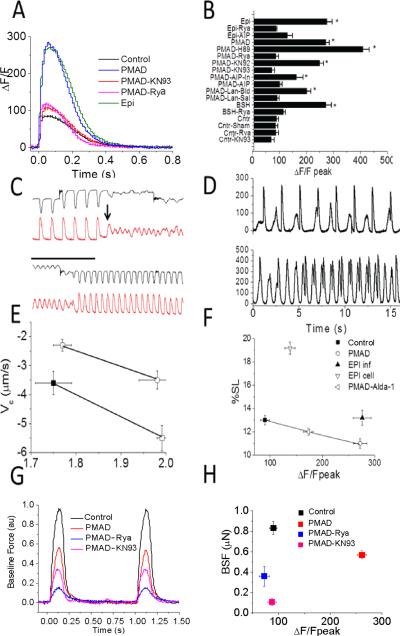
FIGURE 3. Cardiac calcium memory after cardiac arrest.
A. Example CICR transients measured by Fluo-5f in control compared against PMAD, and also PMAD in which arrest was generated in the presence of KN93 (PMAD-KN93) or ryanodine (PMAD-Rya), as well as a control animal exposed to IV infusion of epinephrine (Epi) for 30 minutes. Cells were paced steadily at 1Hz. B. Pooled analysis of ΔF/Fpeak for all conditions tested. The ΔF/Fpeak was significantly higher in animals exposed to epinephrine infusion and cardiac arrest. Ryanodine and KN93 reduced ΔF/Fpeak to control levels in PMAD ventricular myocytes. WT was no different than sham. n=114, 135, 89, 16, 17, 9, 11, 15, 11, 31, 20, 51, 32, 119, 19, 11 cells for control, PMAD, PMADAIP, PMAD-AIP-IN, PMAD-KN93, PMAD-KN92 PMAD-Rya, Epi infusion, control-KN93 (Cntr-KN93), control ryanodine (Cntr-Rya), epi infusion with ryanodine (Epi-Rya), PMAD-Langendorff-Saline (PMAD-Lan-Sal), PMAD-Langendorff-PMAD blood (PMAD-Lan-Blood), Brainstem herniation (BSH), BSH-ryanodine (BSH-Rya), and PMAD-H89. Cntr-Sham experiments demonstrated no difference compared with control. P values compared to control for PMAD, Epi infusion, BSH, PMAD-Lan-Blood were 6.4e-24, 2.2e-18, 2e-25, and 2e-14 (corrected for multiple comparisons). C. Example CICR transients (red) and sarcomere shortening (black) prior to and after carbon fiber stretch. Top set showed stretch followed by a delayed calcium release (black arrow) initiating fibrillatory behavior in both traces. Lower panel showed 30 seconds later termination of “arrhythmia” through rapid pacing. D. Example CICR transients from two different PMAD cells. Top panel showed CICR in response to electrical stimulation followed delayed calcium transients. Bottom panel showed spontaneous calcium transients competing for paced rhythm. E. Pooled analysis of velocity of contraction (Vc) vs sarcomere length for control and PMAD. Baseline (filled) and stretched (open) for pairs of similar stretches from ~1.8 μm ~ 2.0 μm. PMAD (red) than control (black); n= 8, 9 cells from 3 and 4 hearts for PMAD and control hearts respectively. F. Pooled data comparing unloaded %SL vs ΔF/Fpeak of CICR under control, PMAD, epinephrine infusion in animal, but not cells (EPI inf), and epinephrine in isolated cells (EPI cell), but not in whole animal), as well as PMAD in the presence of Alda-1 (PMAD-Alda, n=25 cells from 4 animals). N for control, PMAD, and Epi infusion are the same as above. G. Baseline Force (BSF) in example cells paced steadily at 1 Hz in control, PMAD, PMADKN93 and PMAD-Rya cells. H. Pooled data for BSF measurements at 1 Hz steady-state pacing in control, PMAD in the presence and absence of KN93 or ryanodine. n= 8, 8, 5, 4 cells for control, PMAD, PMAD-KN93, PMAD-Rya.

