
Fig. 5. In vivo MIP imaging of lipid and protein in C. elegans.
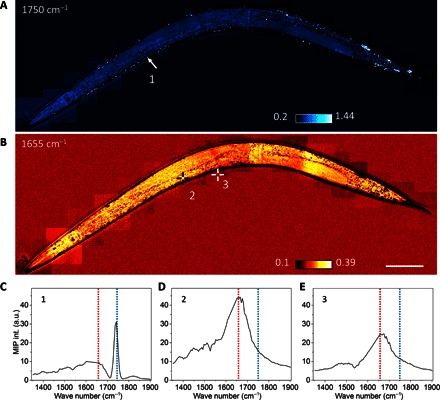
(A) MIP imaging of the worm body at the 1750-cm−1 lipid C=O band. 1, Lipid droplet. (B) MIP imaging of the same area at the 1655-cm−1 protein amide I band. 2, Worm body; 3, medium. (C to E) Pinpoint spectra of locations 1, 2, and 3, as indicated in (A) and (B). Blue and red lines indicate the wavelengths used in (A) and (B), respectively. Pixel dwell time, 500 μs. Scale bar, 200 μm.