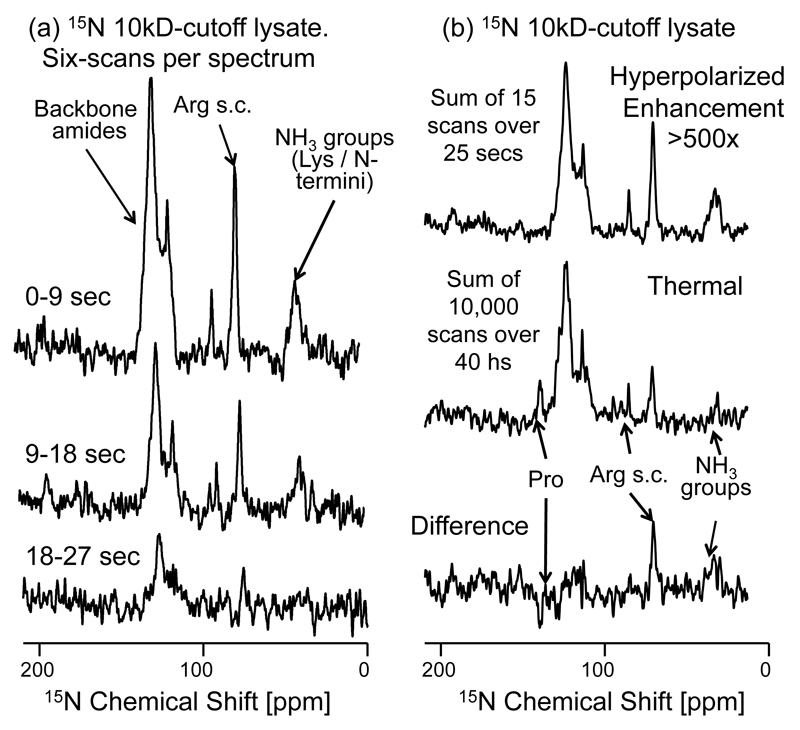
Figure 7.
Enhancement of 15N signals in a 15N-labeled polypeptide lysate with molecular weight cut-off of 10kDa, via polarization transfer from hyperpolarized water. (a) 15N NMR spectra arising from 90° 15N pulses applied over the indicated post-dissolution times, reflecting the 17.9 sec T1 we detect for the water protons onto the 15N signals enhanced by the exchangeable protons. The sum of six consecutive scans from this time series are displayed. (b) Sum of first 15 scans (upper trace) following the injection of hyperpolarized water, compared vs a thermal equilibrium 15N spectrum (middle trace), measured by signal averaging 10000 scans over the course of ca. 40 hours. The difference between these spectra is displayed in the bottom trace, highlighting the over-enhancement of the arginine side-chains (NH2) and lysine’s (NH3) groups, and the under-enhancement of the proton-less proline backbone nitrogens. The average signal enhancement of the 15N backbone amides is >500× relative to 15N thermal equilibrium signal. Other acquisition parameters are as in Figure 5.

