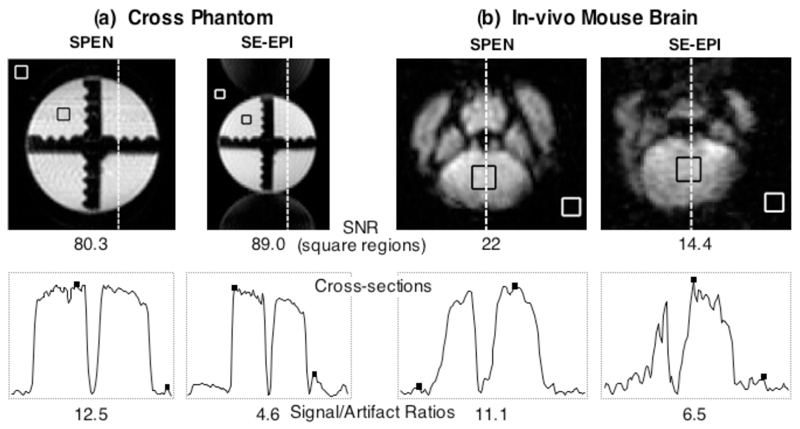
Figure 6.
Comparison between images and corresponding cross-sections arising from the sequences introduced in the multi-slice 2D single-scan sequences of Figs. 1b, 1c, implemented on phantom (a) and in vivo (b) samples. The 1D cross-sections shown at the bottom were extracted at the positions indicated by the dashed lines, and run in both cases along the low-bandwidth PE/SPEN axes. Indicated in the images are the square regions chosen as representative signal and the thermal noise regions for the SNR calculations reported underneath each 2D plot. The square dots in the cross-sections indicate the signal and the characteristic artifact intensities used to compute the Signal/Artifact ratios reported on the bottom.

